NB: The following is an abridged version-those seeking full details should refer to the full version at
http://fxmarketanalysis.wordpress.com/
FX: higher equities, today bias against safety currencies [JPY, USD, CHF in order of safety appeal] vs. risk currencies [AUD, NZD, CAD, EUR, GBP in order of risk appetite appeal], USD up on Fed moves, Black Fri Monday, losing ground Tuesday morning.
- Main events today: NZD: Building Consents m/m+, CAD: GDP m/m= USD: Chicago PMI+, Tues.AUD Building Approvals-, Cash Rate-, RBA Statement, CNY: Mfg. PMI+, GBP Nationwide HPI m/m+, Halifax HPI m/m, Mfg. PMI, USD: Mfg PMI, Pending Home Sales m/m, Wed: GBP Halifax HPI m/m, USD: ADP NFP, Fed Beige Book
- Big Theme: Stocks, Risk Stabilizing after Dubai Crisis Appears Contained For Now-See Conclusions below for trading opportunities. TRADERS SHOULD HAVE TRADING PLANS READY FOR MOVES IN EITHER DIRECTION, still unclear if markets have fully digested the US jobs data, and news this week is light, suggesting trading with ranges
STOCKS
US: Stocks spent the afternoon trading with modest losses after rolling over in the early going, but they managed to make a late push into positive ground during the final hour of trade. The move was led by the financial sector, which actually had been unable to provide a lift to the broader market for most of the session, as fears about Dubai eased and Chicago PMI showed manufacturing improving. The Week Ahead: Dubai, Holiday Sales, NFP & Employment to Dominate Trading – See Weekly Outlook, Full Version
Asia: HONG KONG (AP) -- Asian stock markets rebounded Monday from their steep fall last week after the United Arab Emirates moved to contain the fallout from Dubai's debt crisis. Most indexes up over 2%
Europe: European shares rose early on Tuesday, bouncing back from falls in the previous session, as fears about the fallout from Dubai's debt problems eased and investors' appetite for relatively risky equities increased
ASIA- UP N225I +2.91% HS +3.25% SSEC +3.20% FTSTI -1.10% AORD +2.57 %
EUROPE DOWN FTSE -1.05% DAX -1.05% CAC -1.11%
US- UP S&P +0.77% DJIA +0.34% NASDAQ +0.29%
ASIA CLOSING UP N225I +2.43% HS +1.34% SSEC +1.25% FTSTI +0.92% AORD +0.37 %
EUROPE OPEN UP FTSE +1.47% DAX +1.46% CAC +1.51%
Oil: PERTH, Dec 1 (Reuters) - Oil rose above $77 a barrel on Tuesday, after a rebound of 1.6 percent in the previous session, as Dubai debt default fears eased and cautious investors cast about for fresh clues to the pace of global economic recovery.
With a series of key economic indicators due out in the United States later in the day, as well as a preliminary snapshot of the weekly U.S. fuel inventory report, traders are expected to stay on the sidelines until they get a clearer picture on the state of energy demand.
US NFP report from related data like the employment portion of the PMI non-manufacturing report and the ADP nonfarms payrolls.
Gold: Steadied Monday morning around $1178, and has resumed climbing early Tuesday to around $1185 as Asian markets close higher and European markets look to open higher. 1200 level should be an important psychological level in the near term and some correction should be seen to keep gold below 1200 for a while, with some risks of a break of 1100 level if there are any major shifts in risk sentiment.
Reports of new IMF sales to Sri Lanka (10 tons) and possible additional purchases by India & China added support.
CURRENCIES: Surprising USD rebound on a mixed but overall up day for global stocks
USD: Gained Monday against the EUR, JPY, GBP, AUD as hawkish Fed moves and a disappointing black Friday cast even more doubt on the critical holiday consumer spending season .While this data supported the USD as a safe-haven asset, there was also positive fundamental news as the Fed began testing was to drain liquidity and exit its stimulus program, though it said it had no plans to do so at this time.
EUR: After breaking back above 1.500 resistance to 1.5071m the EUR dropped back yesterday to close lower at 1.5010, despite positive CPI data that makes interest rate increases more likely. Eurozone CPI rose to 0.6% y/y versus consensus 0.4%.
JPY: Down vs. USD on intervention threats from BoJ, new stimulus measures. National Strategy Minister Kan announced that the Japanese government has agreed on measures to stop the JPY's rise. Financial Services Minister Kamei also put pressure on the BOJ and suggested the BOJ has to consider ways to ease monetary policy further.
GBP Down vs USD, GBP: European banks have 72% exposure to the $26 billion of Dubai debt under restructure. UK banks have about 41% of that, making the UK banking system the most exposed to Dubai's crisis.PMI disappoints Tuesday
AUD: Raises interest rates 25 bps to 3.75%, yet down today against the USD and JPY on profit taking, as the RBA gave no timetable for further increases, and the move was largely expected given recent official statements by RBA Deputy Governor Battelino,
NZD: Fell yesterday vs. the USD, rising in early Tuesday trade. Rising dairy prices should provide support for both the economy and NZD, as these push interest rate rises closer. Likely to move with overall risk appetite, the overall direction of which remains up, though vulnerable
CAD: Moving up against the USD w/ rising oil, stocks
CHF: Monday it gained against EUR, dropped against the USD, these trends are reversing early Tuesday. Q3 GDP as forecasted at 0.3%
CONCLUSIONS: S&P 500 still struggling around 1100 resistance, still unclear if stocks and other risk assets are going to stay flat, pullback, or make a yearend run. Liquidity and low rates support stocks and other risk assets as cash seeks a parking spot, but questions on valuations and still poor fundamentals weigh against stocks, and have many believing the rally is in trouble and that a bearish double or triple top is forming. See Trading Opportunities section below. Traders should consider going with the current trend but be ready for pullbacks. See below for specific opportunities with the S&P 500, CRUDE, GOLD, EURUSD, and NZDUSD.
Trading Opportunities: Near term has favored risk currencies, shorting safe-haven assets. Today's news provides potential volatility for r the EUR/USD and USD/CAD in particular. Given that markets remain very high despite mixed earnings and negative US jobs reports, they're vulnerable to a pullback at this 1100 resistance level for the S&P 500: 1. Be prepared to play a pullback in risk assets and get ready to sell stock indexes, commodities, and risk currencies, buying USD, JPY. 2. Trade the near term horizontal trading ranges that should hold until major news causes a change in risk appetite. 3. Those continuing to take long positions in risk assets should consider tight sell stops, though gold and crude may be approaching new breakouts. Crude oil breaches key $74 resistance, implying more upside unless stocks pull back on earnings disappointments. Always use sell stop orders.
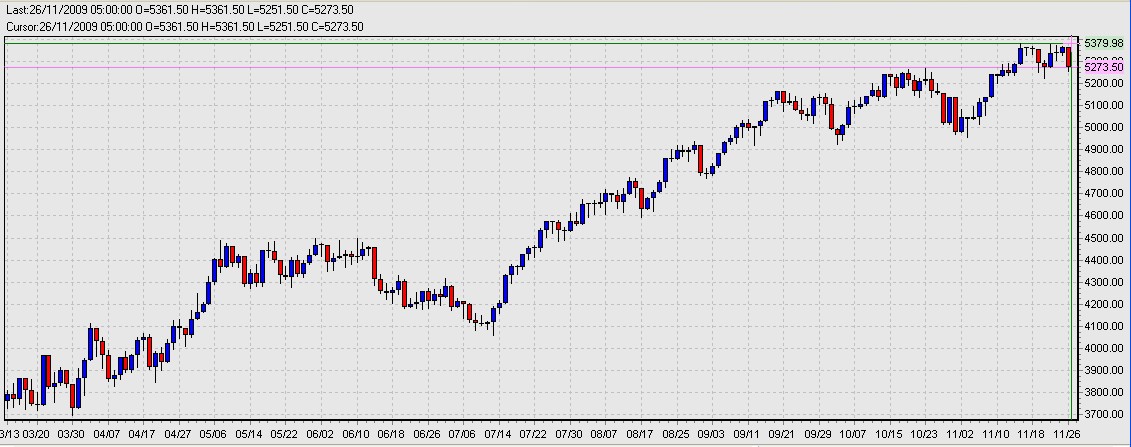
S&P 500: After dropping hard on Dubai news, continues regaining about half of losses in early Monday trade. Resistance at 1110 where there is a convergence of both the upper Bollinger Band and a bearish doji candlestick from Nov. 18th, surrounded by equally indecisive spinning top candlesticks. Also of concern, the price level is currently in the middle of its rising channel, and the current $1100 level is itself a price resistance level. Thus we believe traders should be wary of opening new positions on this index and on all other assets until we get a decisive move above or below 1100. As noted above, it’s a struggle between liquidity pushing stocks up vs. concerns over the underlying fundamentals and high valuations that suggest selling. Add to that brew the unresolved Dubai crisis, a disappointing Black Friday, Fed preparations to reduce liquidity, and the added uncertainty of US Non Farms Payrolls and unemployment this Friday makes for a potentially volatile week. Unclear how it will play out. Because the S&P 500 is so representative of overall risk sentiment, and thus the "One Chart to Rule Them All", this indecisive picture suggest traders should make long or short moves when the S&P hits support levels at 1076 (Fib retracement +20 day MA + some price support from mid-October + rising trend line) or a decisive break over 1100. Traders should be very cautious opening long positions in ANY risk assets at this time, and employ tight trailing stops or monitor positions closely on existing open long risk asset positions. They should also have some short positions planned, complete with initial and confirming indicators, and planned entry/ exit points.

S&P 500 Daily Chart as of Dec 1 08:47 GMT (03 Dec 01) (chart courtesy of avafx.com)
GOLD: Showing renewed strength on a combination of rising risk appetite Monday and news of new gold purchases from Sri Lanka and possible new ones coming from China and India. While the dollar seems stuck in a long term downtrend as well, this combination of fundamentals suggests a long term uptrend for gold. Look to purchase on pullbacks.
Gold Daily Chart (04 Dec 01) (chart courtesy of avafx.com)
From a technical perspective, the below chart shows possible retracement points if/when the move makes normal retest of support. Note how gold tested to the 23.6% and 38.2% Fibonacci retracement drawn from its last pullback to its recent high, exactly as one would expect. It appears that this 1130-60 level is some kind of mild support level, given the convergence of both Fibonacci and mild price support.
Also, recent price action suggests near term the rally still has strength, as gold's decline was quite muted on a daily basis, though on shorter term charts it appeared more dramatic. This is why we prefer the perspective of the daily timeframe vs. intraday timeframes when analyzing the big picture of a trend.
As noted in our Global Markets Outlook 11/23-11/27, the belief that there are large buyers like central banks seeking to buy gold may have caused a new fundamental upward shift in price based on this perceived demand. While gold was not immune from the Dubai induced panic late last week, it has recovered those losses already, and is close to recovering its steep upward trend line. This relative strength suggest that if markets truly calm down, gold could resume its climb, even if global equity markets remain pressured by the weight of the extended rally, valuation concerns, and year-end tax selling.
There's a growing belief in a new fundamental factor -- that underlying demand for gold has increased due to central bank buying. After the Reserve Bank of India, the Bank of Mauritius bought 2 metric tons of gold from the IMF at market price on November 11. Compared with India's 200 metric tons, Mauritius' purchase was insignificant. However, same as the deal with India, the implications radiate far beyond the size of the deal itself.
Earlier this year, the IMF announced its plan to sell a total of 403.3 metric tons of gold to bolster its finances. The news weighed on market sentiment as investors worried about at how much and to whom the gold would be sold. Now, more than half of the planned amount has been sold to official sectors at market prices, sentiment appears to have shifted from concern over overhanging supply to disappearing supply as large exporter central banks and sovereign wealth funds seek to convert depreciating dollar holdings into gold. Right or wrong, that is the sentiment at this time, and it's been strong enough to send gold soaring while crude and stocks have been stalling out. Impressive relative strength that has won many believers and convinced markets that any pullback will not be pronounced or long.
Consider:
• In April, China, the biggest gold producer in the world, increased reserves by +76% to 154 metric tons since 2003. The market anticipates China will be another big buyer of IMF's gold.
• Since the beginning of 2009, gold price has rallied almost +30%. Also, after breaching 2008-high at 1033.9, the yellow metal's rise has accelerated, jumping more than 100 dollars in a month. The long-term uptrend is not likely to end soon.
• Apart from government buying, new private gold funds should give a further boost to robust investment demands. John Paulson announced his plan to launch a new gold fund next year with as much as $250M of his money. Large gold ETFs or funds usually have holdings that are comparable to central banks. For instance, SPDR Gold Shares, the world's largest gold ETF, is the world's 5th largest bullion owner just below France and above China.
In short, it's not just increasing gold demand, but demand from big buyers.
In coming weeks, gold price should continue to be very much directed by USD's movement. However, the inverse relationship between gold and the dollar should not be taken for granted. For instance, in the 90s, the yellow metal's supply was so abundant that its price plummeted. In 2005, gold price surged due to tightness in the market. Therefore, some analysts hold that gold price may continue to rise given the reduction in gold production and increase in central bank demand, despite a possible rebound in USD early next year. Famed NYU Economics Professor Nuriel Roubini, credited for calling the current crisis years ago, believes the run in gold is an unsustainable bubble, while famed commodity trader Jim Rodgers holds gold is going much higher. As long as the central bank/sovereign wealth/momentum story holds up, Rogers looks correct.
Crude Oil: Still in a 5 week downward channel. Range trading between $82-$76/bbl since mid October, moving more or less with stocks as the S&P struggles at the $1100 resistance level and oil at $82, neither to move higher until further positive news on the recovery. However, with gold having continued higher to $1194 as of this writing, the historic gold ratio now justifies oil as high as around $99.50 (12:1 ratio) and no less than $77.80 (15:1). Thus while crude remains range bound, if gold can continue breaking to new highs, as many expect it to do, then crude could follow it sharply higher over time, especially if other risk assets can avoid a sharp correction (which they are doing nicely, as shown by the S&P 500 breaching resistance at $1100) or there is evidence of continued strong demand from China and other developing economies.
NB: Crude has been among the weaker risk assets over the past month despite the USD's weakness. Crude peaked weeks before stocks did, and has been behaving relatively worse than stocks. For example, yesterday's action showed that stocks were still able to retain some of their gains when momentum reversed, but crude could not, and closed lower. Not surprising, since crude tends to exaggerate the S&P 500's trends for better and for worse. Range bound for the near term, will likely follow stocks higher to its upper range near $82 if stocks can rally, but poor fundamentals and an extended rally for both oil and the S&P 500 that it tracks suggest more downside risk at this time.
Certainly seems unwise to consider new longs until oil stabilizes, likely around the $73-$60 range, if not lower. An additional outcome of the Dubai crisis may be increased production as the UAE may need to produce more oil in order if it decides to fund a bailout or related assistance to stabilize the Dubai situation. Watch the S&P 500 to lead oil.
WTI Crude Oil Daily Chart (05 Dec 01) (chart courtesy of avafx.com)
EURUSD: Breaking above 1.5000 resistance again to after dropping on Dubai fears, approaching new annual highs. Still at the lower end of its rising channel, abundant support points below it for low risk stop loss setting if going long should risk sentiment continues.
EURUSD DAILY CHART (06 Dec 01) (chart courtesy of avafx.com)
As noted in our Global Outlook for 11/30-12/04:
The Euro finished the week only marginally higher against the US Dollar, but the modest week-to-week change belies impressive volatility in recent trading. The EUR/USD moved to a fresh 2009 peak near the 1.5150 mark as the USD dropped market-wide. As discussed above, the credit scare out of Dubai sent the safe-haven US dollar and Japanese Yen substantially higher through Asian and European market hours. The nasty surprise came as a sharp reminder that financial market risk sentiment remains skittish and the USD extremely shorted, making it ripe for sharp moves higher if the USD-short herd stampedes to the exits. The week ahead could prove similarly eventful on strong economic event risk out of Europe and the US. Thus use caution going long the EUR.
However, Friday's session suggests the EUR may well maintain it's near term trend against the USD barring new bad news from Dubai. Although dollars were bought aggressively throughout the Asian and European trading session, the correction in the U.S. session suggests that the overall trend for the dollar is still down.
However, this pair is closely correlated with risk appetite and thus the S&P 500, which is struggling at resistance, and will have end of year tax selling and a likely bleak retail season to cope with. Given the factors working against risk appetite over the coming weeks, we urge caution (and tight stop losses) for new long positions, and plans for some short positions should markets turn, with planned entry/exit points.
NZDUSD: Unclear for now, stand aside and wait for overall market direction (aka S&P 500 or other preferred major stock index). Moving with risk appetite, which could go either way in the coming days depending on various news events and the continuing resolution of the Dubai crisis. As noted above, firming dairy prices should be supportive of the NZD, though local events tend to be overwhelmed by overall risk sentiment. Near strong support around 0.7100, which would make a good entry point for those playing the long or short side, depending on one's' read on the direction of global stocks and risk appetite.
NZDUSD Daily Chart (08 Dec 01) (chart courtesy of avafx.com)
OTHER HEADLINES
Bloomberg.com
Global Stocks Rally on BOJ Emergency Lending, China Economy; Yen Declines
•Japan's Central Bank to Pump Cash Into Economy on Lower Prices, Higher Yen
•China Manufacturing Grows at Faster Pace, Helping Asia Lead World Recovery
•Dubai World Starts Talks With Banks on Restructuring $26 Billion of Debt
•Australia Raises Interest Rates for Third Straight Month as Economy Grows
•GM May Sell Some Saab Unit Assets to Beijing Automotive, Discontinue Brand
•Manufacturing in U.S. Probably Grew in November, Taking Lead in Recovery
•Obama's Troop Increase Means He Now `Owns' Unpopular Afghanistan Conflict
•Iran Holds Five-Member Crew of British Racing Yacht, U.K. Government Says
•Spanish Bullrings, Fake Eiffel Towers Can't Prevent 20% Unemployment Rate
(Seekingalpha.com)
Case-Shiller: Home Prices Continue to Rise
Murdoch’s Bing Bluster Will Hurt News Corp, Not Google
How to Trade the Rest of the Year - Goldman Sachs
10 Common Myths About ETF Investing
Do Black Swans Negate Option Premiums?
Another Crisis Looms Right Around the Corner
Wall Street Breakfast: Must-Know News
How to Trade the Rest of the Year - Goldman Sachs
Apple's AT&T Deal: Setting the Record Straight
Seven Dividend Stocks to Take the Emotion Out of Investing
DISCLOSURE AND DISCLAIMER: OPINIONS EXPRESSED ARE NOT NECESSARILY THOSE OF AVAFX, AUTHOR HAS NO POSITIONS IN ABOVE INSTRUMENTS.